Why Standard Deviation in Blackjack Sessions Matters More Than You Think
- What Standard Deviation Tells You About a Blackjack Session
- How Does Standard Deviation Grow as Your Session Gets Longer?
- How Do You Set Realistic Session Expectations Using Standard Deviation?
- Why Do Side Bets Explode Your Standard Deviation Even Further?
- Using Standard Deviation to Protect Your Bankroll and Your Mindset
[bja_toc]
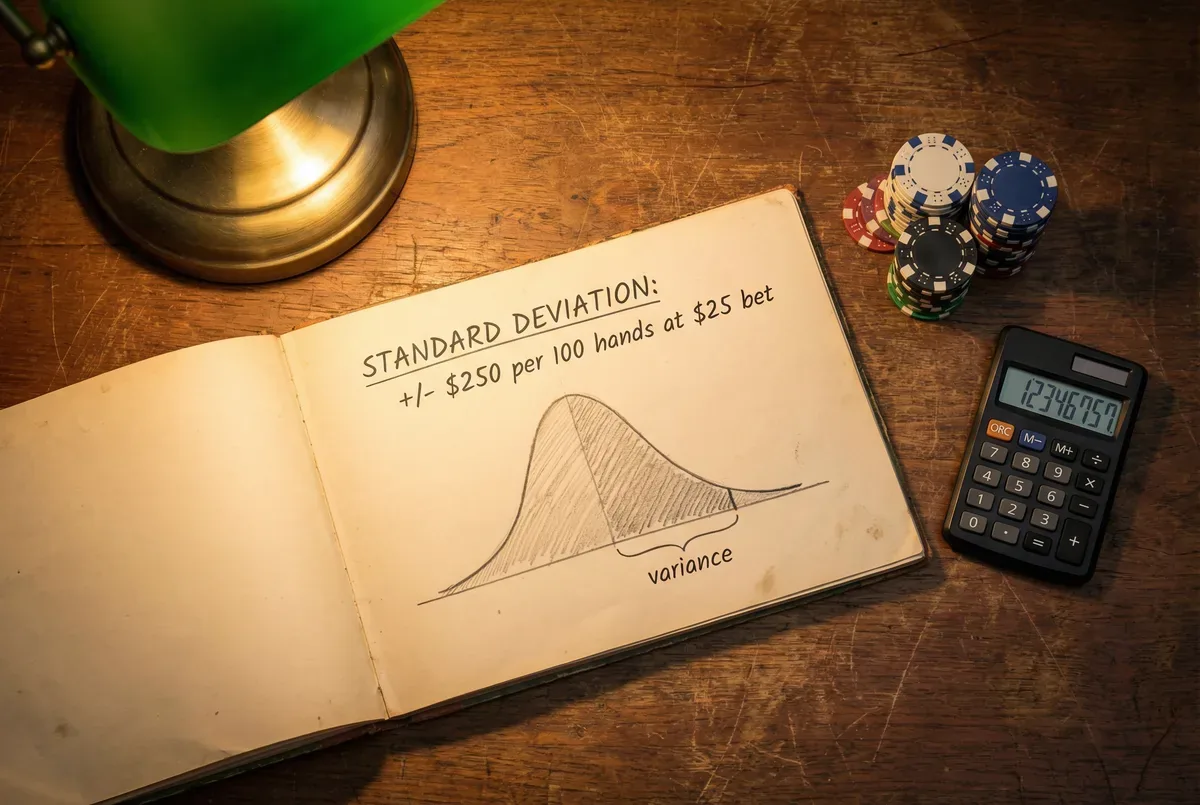
Standard deviation (SD) in blackjack measures how much your actual results can diverge from expected value in a given sample of hands. For a standard six-deck game with flat $25 bets, one standard deviation over 100 hands is approximately $125. That means roughly 68% of the time your 100-hand result will land within one SD — between about $112 ahead and $138 behind, accounting for a small negative expected value from the house edge. Two standard deviations covers about 95% of outcomes, which means results spanning from $250 up to $262 down are entirely normal and statistically expected across sessions. Being up $200 after 100 hands does not mean you played brilliantly. Being down $200 does not mean you played poorly. Both outcomes fall within the normal distribution of variance for that session size.
What Standard Deviation Tells You About a Blackjack Session
Standard deviation is the statistical measure of how spread out a distribution of results is around its mean. In blackjack, the mean of your results over time is your expected value — a small negative number for basic strategy players (approximately -0.44% of total money wagered) and a small positive number for skilled card counters with a meaningful edge. The standard deviation describes the width of the band around that mean within which most individual session results will fall.
For a flat bettor at $25 per hand, the standard deviation per hand in blackjack is approximately 1.15 units — about $28.75 — driven primarily by the binary win/loss structure of most hands, the occasional double and split that creates larger individual outcomes, and the 3:2 natural payout that introduces asymmetric positive swings. Over 100 hands, the combined SD is approximately $125. Over 400 hands, it is approximately $250. The square-root relationship between hands and SD is what governs how quickly results converge toward expected value over time.
1 SD per hand (flat $25 bets)
per hand
1 SD over 100 hands
total range
1 SD over 400 hands
total range
How Does Standard Deviation Grow as Your Session Gets Longer?
Standard deviation scales with the square root of the number of hands played, not linearly. Double your hands and SD grows by roughly 41%, not 100%. Play 400 hands and SD is twice what it is at 100 hands, not four times. This square-root relationship has a critical practical implication: the more you play, the more your results converge toward expected value as a percentage, but the larger the absolute dollar swing can become in any given session.
A recreational player who plays 50 hands once a month will experience results that look almost random — because at that sample size, variance completely dominates the expected value signal. The house edge of 0.44% across 50 hands at $25 produces an expected loss of approximately $5.50 per session. But one standard deviation for that session is roughly $88. The signal (a $5.50 expected loss) is essentially invisible inside the noise (an $88 swing either direction). It takes tens of thousands of hands before your win rate starts to reliably approximate your mathematical expectation. This is not a bug in the game design — it is the variance that keeps recreational play interesting and the casinos profitable across a visitor population that rarely plays enough hands for the math to fully assert itself.
The implication for bankroll management is direct. Because a 400-hand session can produce a 1-SD swing of $250 in either direction — with a 5% probability of exceeding $500 in either direction — your session bankroll must be sized to survive those swings without going broke. A player who brings $200 to a $25 table for a 400-hand session is starting with 8 units of bankroll against a 1-SD swing of 10 units. At some probability of a bad run, they will bust out before the session ends. The standard rule of 40 buy-in units is calibrated specifically to absorb this kind of variance without ruin at normal session lengths.
Common Myth
“A $300 loss after 100 hands at $25 proves I was playing incorrectly”
Players assume bad results indicate bad play because they underestimate how large normal variance is at short sample sizes
The Reality
A $300 loss in 100 hands at $25 bets is a 2.4-SD event — unusual but not rare, occurring roughly once in 60 sessions by pure variance alone
Evaluating play quality requires reviewing the accuracy of decisions, not the session profit or loss. A session where you made every correct play and lost $300 is a better session than one where you made errors and won $300. The results will converge; the decision quality will not improve on its own.
How Do You Set Realistic Session Expectations Using Standard Deviation?
The practical application of SD knowledge is building a session range before you sit down. Take your flat bet, multiply by approximately five to get a rough 1-SD figure for 100 hands, and use that number to set a statistically grounded stop-loss. At $25 bets, a reasonable stop-loss for a 100-hand session is two standard deviations below expectation — approximately $250. This is not a guaranteed floor — 5% of sessions will exceed 2 SD in the negative direction — but it gives you a number rooted in mathematics rather than arbitrary comfort.
The more useful mental shift is treating session results as samples rather than verdicts. Any individual session tells you almost nothing about the quality of your strategy. A sequence of five losing sessions in a row, all within normal SD range, is consistent with perfect basic strategy play. A run of five winning sessions tells you equally little about your actual edge. What matters is whether you are making the correct decision on every hand — and that can be evaluated independently of outcome by tracking your decision accuracy, not your chip stack.
Before every session, I calculate my expected 1-SD range for the session length and stake I am playing. At $25 flat for 200 hands, that is approximately $177 in either direction. I set my stop-loss at 2 SD — $354 — and I write it down before I sit. When I reach that number, the session ends regardless of how I feel about the run. Variance is predictable in aggregate. The stop-loss discipline is what keeps individual bad sessions from cascading into something that cannot be recovered by continued play.
Why Do Side Bets Explode Your Standard Deviation Even Further?
Side bets in blackjack — Perfect Pairs, 21+3, Insurance, Lucky Ladies — carry house edges of 3% to 10% or more, but also dramatically higher variance than the base game. A Perfect Pairs side bet pays 25:1 on a perfect pair and 6:1 on a mixed pair, with most combinations losing. The variance of that payout structure is enormous relative to the main bet. When you layer side bets onto your session, you combine a high-edge bet with high-variance payouts — the worst possible combination from an expected-value perspective.
The combined standard deviation of a session mixing main bets and side bets rises substantially above the flat-bet calculation. You experience larger swings with a worse underlying edge. In the short run, a side bet hitting at 25:1 feels like evidence of a positive-EV decision. In the long run, the house edge on that side bet extracts a structural cost that exceeds the main game by 5 to 15 percentage points on every unit staked on it. Understanding SD makes this trade-off quantifiable: you are voluntarily accepting more swing in exchange for dramatically worse expected returns. That is the opposite of bankroll management.
Using Standard Deviation to Protect Your Bankroll and Your Mindset
The most underrated benefit of understanding standard deviation is psychological protection. When you know that a 2-SD downswing is statistically normal — occurring in roughly 1 in 40 sessions — you do not interpret a bad run as evidence that your strategy is broken. You do not chase losses with larger bets because you are aware that the expected value of each subsequent hand is identical regardless of previous results. And you do not attribute a winning session to skill when the result may be variance working in the positive direction.
This clarity is worth more in practice than any bet-sizing adjustment or pseudo-strategy system. Players who do not understand variance respond to losing sessions by changing their strategy, increasing their bets, or abandoning correct decisions in favour of hunches. All of these responses convert a variance-driven temporary loss into a strategy-driven systematic loss that will persist across sessions. The mathematical structure of blackjack is fixed and predictable. The only thing a player controls is decision quality on each hand and bankroll management across sessions. Standard deviation gives you the framework to manage both without confusion about what individual sessions mean.
For running session analysis and tracking how your actual results compare against the expected SD range over many hands, the free blackjack simulator logs decision accuracy alongside outcomes so you can separate variance from errors. When you are ready to experience what a real 1-SD swing feels like under live conditions with real money on the line, a live dealer session at your planned stake level is the most honest environment for testing your stop-loss discipline before applying it at a physical casino.
Frequently Asked Questions
Approximately $125 for one standard deviation, meaning 68% of sessions will end within $125 of your expected value. A $250 swing in either direction is a 2-SD event and occurs in roughly 5% of sessions — unusual but entirely statistically normal.
No. Basic strategy minimises the house edge but does not meaningfully reduce session-to-session variance. Variance in blackjack is driven primarily by the inherent randomness of card distribution, the occasional double and split, and the 3:2 natural payout — not by strategy choices.
Tens of thousands. At fewer than 10,000 hands, variance dominates and short-term results tell you almost nothing about your underlying play quality. Card counters typically require 50,000+ hands before their true count edge becomes consistently visible through the variance.
Mathematical Risk Warning
Standard deviation means real money swings in both directions. A statistically normal 2-SD session can produce losses equal to several times your expected value. Always set a hard stop-loss limit before playing and treat it as absolute.
Blackjack Academy is an educational resource. All strategy recommendations are based on mathematical expectation. Always gamble responsibly and within your means.

Written by
Mark AnurakProfessional card counter since 2009 · 500,000+ hands logged · Former Macau advantage player. Studied under Thorp, Griffin & Wong methodology. Full bio →
Learn More
Continue your education with these related lessons.

What the House Advantage Percentage Really Means for Your Bankroll
House advantage is not an abstract casino term it is the exact rate at which your money transfers to the…

How to Recover from a Losing Blackjack Session
You cannot recover a losing session by playing more hands in that same session. Here is the statistical reality of…

How to Calculate Your Blackjack Expected Loss Per Session
Learn the exact formula for calculating your expected loss at the blackjack table. House edge × average bet × hands…