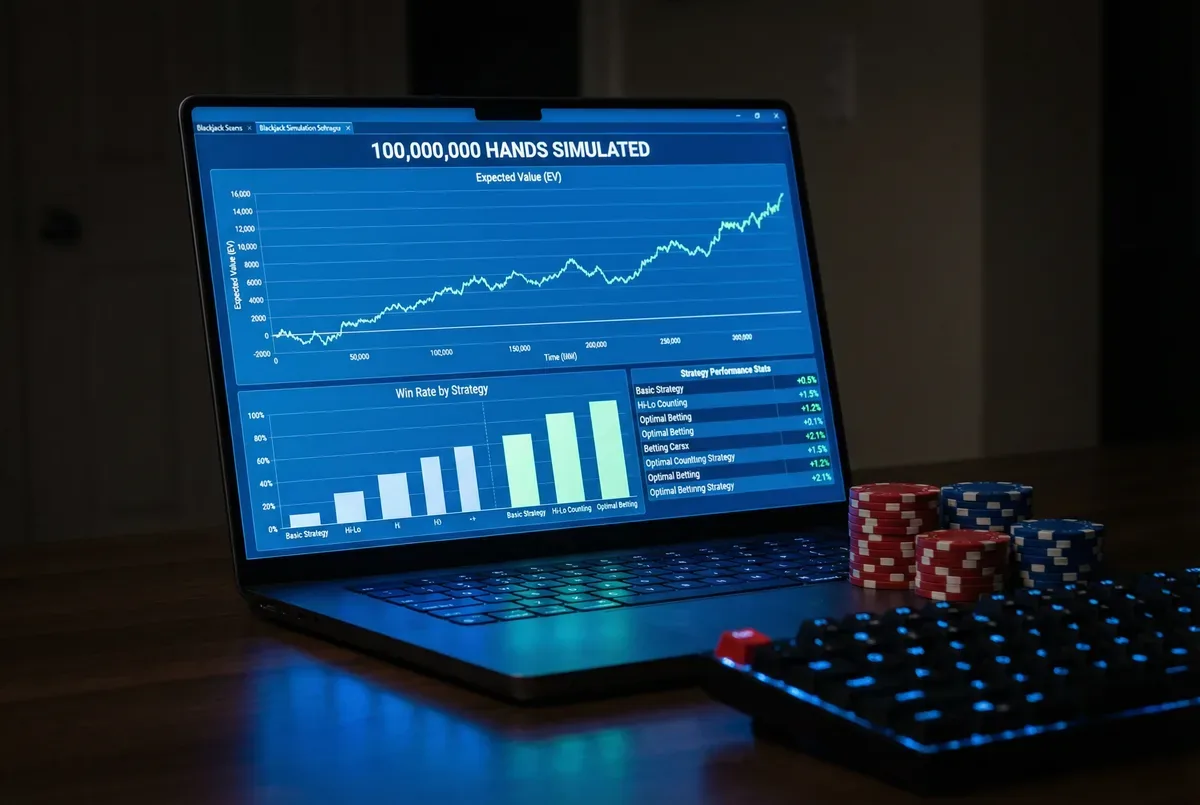
What 100 Million Hand Simulations Teach Us About Winning
Blackjack simulation software can run millions of hands in seconds, eliminating the ambiguity of short-term results and exposing the true mathematical structure of the game. When simulations cross the 100-million-hand threshold, the results stabilize to within fractions of a percent of theoretical expectations, and patterns that appear significant in shorter samples reveal themselves as either genuine mathematical effects or pure statistical noise.
Large-Scale Simulations Confirm What Theory Predicts and Reveal What Intuition Misses
The first confirmation is the most important: blackjack basic strategy is real and measurable. Simulations run with correct blackjack basic strategy consistently produce blackjack house edges of 0.4–0.6% in standard 6-deck games, while simulations using common deviations (standing hard 12 against dealer 2, not doubling 11 against dealer 10, taking insurance) show edges of 1.5–3%, confirming that strategy errors cost exactly what the individual hand calculations predict when accumulated over massive samples.
The second confirmation is equally important for betting system believers: no betting system produces different results from flat betting at the same average stake over 100 million hands. The distribution of outcomes changes systems produce different patterns of wins and losses within sessions but the total expected value remains identical. This is not a theoretical claim; it is a directly measured result.
Basic strategy edge (6-deck, standard rules)
% confirmed across simulations
Common deviation from basic strategy adds
% additional house edge
Betting system impact on EV vs flat bet
% difference over 10M+ hands
What Simulations Say About Variance and Session Length?
Perhaps the most practically useful finding from large simulations is the distribution of session results. In a 200-hand session at standard 6-deck rules with flat betting, simulations show: approximately 43% of sessions end positive, 54% end negative, and 3% are near-breakeven. The range of outcomes spans from plus 40+ units to minus 40+ units, with the median result slightly negative and the mean converging to the theoretical edge over millions of trials.
This distribution has a critical implication: a player with 10 sessions of data has sample results that tell almost nothing about their actual expected outcome. Ten sessions span at most 2,000 hands not enough statistical power to distinguish a 0.5% edge from a 1% edge against the background noise of normal variance. Players who judge their strategy quality from 10 sessions are working with noise, not signal.
Simulations also reveal exactly how long losing streaks of various lengths occur. At the 0.47% win probability per hand (excluding ties), the expected frequency of 7-consecutive-loss streaks is 1 in every 128 sequences approximately once in a typical 200-hand session if those sequences overlap. Players who believe 7-loss streaks are unusual are surprised during their first long session. Simulations make the expected frequency concrete and remove the shock.
Common Myth
“Winning 4 sessions in a row proves my system is working”
Consecutive wins feel like validation of a strategy
The Reality
Simulations show that winning 4 sessions consecutively happens by pure variance approximately 5% of the time with basic strategy alone no system required
4 consecutive wins provides almost no statistical evidence of a positive edge. You need 500+ sessions to begin detecting a genuine 0.5% edge difference
What Simulations Reveal About Rule Sensitivity?
Simulations are the most reliable way to measure the exact impact of rule variations. The commonly cited figures 6:5 adds 1.4%, dealer hits soft 17 adds 0.22% are derived from exactly this kind of analysis. When 100 million hands are run with and without a specific rule change, the resulting edge difference is measurable to three decimal places.
How Should Simulation Data Shape Your Next Session?
Simulations also reveal a finding that surprises many players: the ranking of plays in blackjack basic strategy is extremely stable across rule variants. The most profitable doubles, the clearest splits, and the hardest standing decisions are consistent across 1-deck through 8-deck games. The strategy table changes slightly with deck count, but the core structure is remarkably similar which is why learning one solid blackjack basic blackjack strategy chart transfers well to most game configurations.
The most important number that 100 million hand simulations produce is this: betting systems have exactly zero impact on expected value over large samples. The Martingale, Paroli, and D'Alembert all produce identical long-run EV to flat betting at the same average stake. Simulations have confirmed this across every betting system ever tested. The only variables that change EV are the rules of the game and the accuracy of your strategy decisions.
Applying Simulation Insights to Real Sessions
Simulation data provides the context that makes individual session results legible. At see these numbers translate at a live table, every real session adds to your personal data set results that, over hundreds of sessions, will reflect your actual edge. Real money produces real variance and real patterns. Only use funds fully budgeted for entertainment, and treat your accumulating session data as personal simulation output that will eventually converge to your true strategy performance.
Frequently Asked Questions
Roughly 10 million hands eliminates most statistical noise for house edge measurements. At 100 million hands, the margin of error on a 0.5% house edge calculation drops below 0.01 percentage points.
That losing streaks of 8 or more hands occur far more frequently than most players expect. A 100 million hand simulation confirms these streaks happen to every player, even with perfect strategy, simply because variance is a mathematical certainty.
Yes, but it is small. The house edge difference between 6 decks and 8 decks under otherwise identical rules is approximately 0.02 percentage points meaningful over millions of hands but negligible for recreational sessions.
Before you test these plays at a real table, run them through our free blackjack simulator practice unlimited hands at zero cost until every move becomes automatic.
Mathematical Risk Warning
Simulation results represent theoretical expectations under ideal conditions. Real-world play introduces human factors including strategy errors, emotional decisions, and suboptimal game selection that typically produce worse results than simulations of perfect play. Use simulation data as a benchmark, not a guarantee.
Blackjack Academy is an educational resource. All strategy is based on mathematical expectation. Always play within your means.
Learn More
Continue your education with these related lessons.

Why Past Hands Have No Effect on Your Future Results
Each blackjack hand is an independent statistical event. Past losses do not make future wins more likely, and winning streaks…

The Complete Guide to Blackjack Staking Agreements for Team Play
Staking agreements let backers fund card counters in exchange for a share of profits. Here's how the typical 50/50 split…
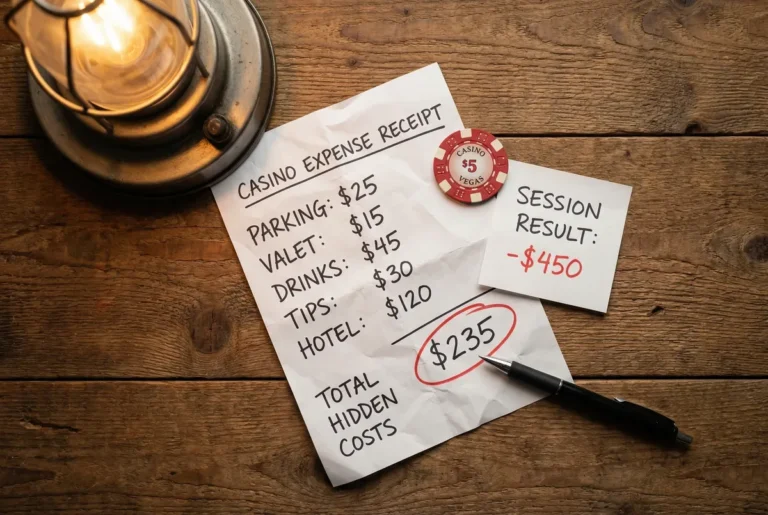
Hidden Costs of Playing Blackjack in a Physical Casino
The house edge is not the only cost of a casino blackjack session. Travel, accommodation, food, drinks, and time all…