
The Bust Probability of Every Dealer Upcard
The blackjack strategy chart does not exist as a list of arbitrary rules. Every stand, hit, and double decision is a direct consequence of two interconnected probabilities: how likely the dealer is to bust, and what your own hand is likely to become. The dealer bust probability for each upcard is the most important number in blackjack strategy it determines whether you play passively (let the dealer bust) or aggressively (take cards and build your own total). Understanding these percentages explains why the chart looks the way it does and gives you a mental framework for every borderline decision you will face. The numbers below are computed across millions of simulated hands under standard Las Vegas 6-deck H17 rules.
Dealer Bust Probability Is the Engine of Basic Strategy
Dealer 2 bust rate
of hands
Dealer 6 bust rate
of hands highest upcard
Dealer 7 bust rate
of hands sharp drop
What Is the Stiff Zone?
When the dealer shows 2 through 6, their hidden card is likely to produce a total in the stiff range (12–16). Since the dealer must hit until reaching 17 or more, a stiff starting total means they must take at least one additional card and risk busting. The bust probabilities in this range are: dealer 2 = 35.3%, dealer 3 = 37.6%, dealer 4 = 40.3%, dealer 5 = 41.7%, dealer 6 = 42.3%. Dealer 5 and 6 are the two weakest upcards in the game the dealer busts more than 4 in 10 hands when showing those cards. This is why you stand on stiff hands, double aggressively, and never take unnecessary risks against upcards 2 through 6. The dealer is doing significant damage to their own hand without any help from you.
Dealer 2 is slightly different in practice the 35.3% bust rate is lower than most players assume, which is why hard 12 is a hit against dealer 2 (not a stand like 4, 5, 6). The bust probability is real but not dominant enough to justify standing on a 12. Dealer 3 is similarly borderline for hard 12 decisions. Against 4, 5, and 6 the bust probability is high enough that standing on hard 12 becomes correct strategy.
| Upcard | Bust Rate | Strategy Implication |
|---|---|---|
| 2 | ||
| 35.3% | ||
| Stand hard 13+, hit hard 12 | ||
| 3 | ||
| 37.6% | ||
| Stand hard 13+, hit hard 12 | ||
| 4 | ||
| 40.3% | ||
| Stand hard 12+ | ||
| 5 | ||
| 41.7% | ||
| Stand hard 12+, max doubles | ||
| 6 | ||
| 42.3% | ||
| Stand hard 12+, all soft doubles | ||
| 7 | ||
| 26.2% | ||
| Hit stiff hands dealer strong | ||
| 8 | ||
| 24.4% | ||
| Hit stiff hands | ||
| 9 | ||
| 23.0% | ||
| Hit stiff hands aggressively | ||
| 10 | ||
| 21.4% | ||
| Hit stiff hands, split 8s | ||
| A | ||
| 11.7% | ||
| Hit everything below 17 |
What Is the Sharp Cliff at Dealer 7?
The transition from dealer 6 to dealer 7 is the most dramatic shift on the entire chart. Bust probability drops from 42.3% to 26.2% a 16-point cliff. This is not a gradual decline; it is a structural break. When the dealer shows 7, the most common hidden card is a 10-value card, producing a dealer total of 17 which means the dealer stands immediately without taking any further risk. Against dealer 7, the dealer completes a made hand more than 73% of the time. This is why your stiff hands become hits against 7 through Ace: passively standing on 14, 15, or 16 will lose the majority of those hands. You must try to improve even at the cost of bust risk.
The bust probabilities for dealer 7 through 10 are remarkably close to each other: 7 = 26.2%, 8 = 24.4%, 9 = 23.0%, 10 = 21.4%. All four upcards produce roughly the same strategy hit every stiff hand, execute your doubles on 10 and 11, don’t stand below 17. Dealer Ace is the outlier with only an 11.7% bust rate, reflecting the dealer’s ability to use the ace flexibly and avoid 22+ totals that would otherwise count as busts.
Dealer Shows
Your Hand
Hard 14 vs dealer 6. The dealer has the highest bust rate in the game. What is your play?
Dealer 6 busts more than 4 in 10 hands. Standing on hard 14 collects those busts without risking your own hand. Hitting risks busting yourself and losing even when the dealer would have busted anyway. Always stand on hard 12+ vs dealer 4, 5, 6.
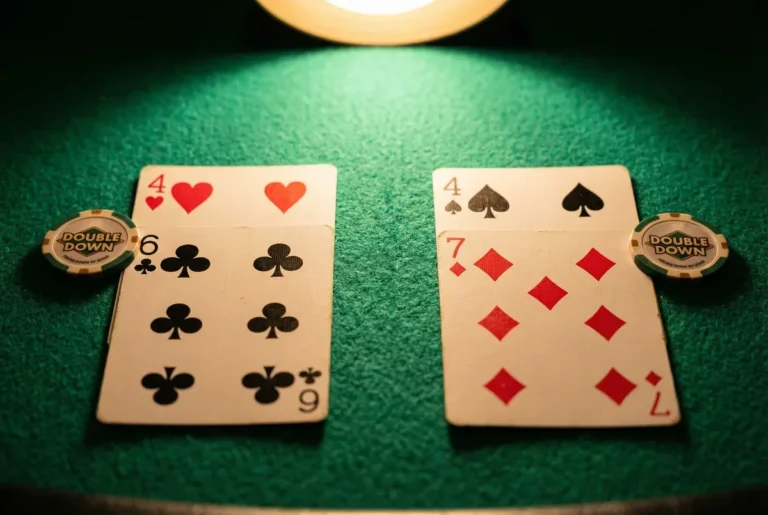
How Bust Probability Determines Doubling Zones?
Doubling down is profitable when two conditions align: your hand is likely to improve significantly on a single draw, and the dealer is likely to complete a weak final total. Bust probability is the primary driver of the second condition. This is why doubling ranges are widest against dealer 4, 5, and 6 every hand that can realistically be doubled benefits from the 40–42% bust probability working in your favor. Against dealer 9, 10, and Ace, doubling opportunities shrink dramatically because the dealer’s low bust probability means they will frequently complete strong totals that beat your doubled hand regardless of what card you draw.
See the Numbers Play Out in Real Time
Probability percentages become visceral when you watch a live dealer bust three times in five hands showing a 6, then sail through six straight hands showing a 7. To experience how these distributions feel in practice, you can play at use this with real money on the table this week just remember that live tables involve real money, and short-term observations of bust rates will always diverge from the long-run averages printed above.
Frequently Asked Questions
Dealer 6, with a 42.3% bust probability the highest of any upcard. Dealer 5 is second at 41.7%. These are the two upcards where standing on stiff hands, doubling aggressively, and splitting all appropriate pairs produces the most profitable player decisions.
Because the ace functions as either 1 or 11. When the dealer has an ace as upcard, they can absorb high cards that would otherwise produce a bust by reverting the ace to 1. This flexibility dramatically reduces bust probability compared to any non-ace upcard, down to just 11.7%.
Marginally. The core percentages shift by 1-2 points between single-deck and 8-deck games but the relative ranking and strategic implications remain identical. Dealer 6 is always the weakest upcard, dealer Ace is always the strongest, and the cliff between 6 and 7 is always the most dramatic transition on the chart.
Before you test these plays at a real table, run them through our free blackjack simulator practice unlimited hands at zero cost until every move becomes automatic.
Mathematical Risk Warning
Dealer bust probabilities describe long-run statistical tendencies. In any single session, the dealer may bust far less or far more than the average rates shown. Strategy based on these numbers is optimal over thousands of hands, not dozens.
Blackjack Academy is an educational resource. All strategy is based on mathematical expectation. Always play within your means.

Written by
Mark AnurakProfessional card counter since 2009 · 500,000+ hands logged · Former Macau advantage player. Studied under Thorp, Griffin & Wong methodology. Full bio →
Learn More
Continue your education with these related lessons.
How to Mentally Track Your Session’s Expected Value
Learn how to calculate and mentally track your session's expected value before you sit down. Convert house edge into real…
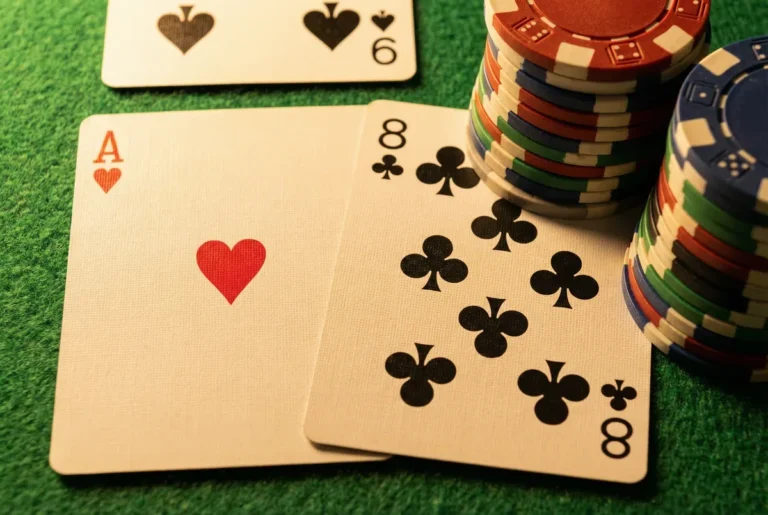
Soft 19 Strategy for Doubling Down Against a Dealer 6
Soft 19 (Ace-8) against a dealer 6 is a doubling hand in single-deck play and a marginal case in multi-deck.…
Complete Post-Split Strategy Guide for Playing Blackjack After Splitting
Post-split strategy explained: playing each split hand independently, why split aces get one card only, re-splitting rules, and doubling after…